May 1, 2020
My dataset that I will be working with is from kaggle at this link.
This dataset includes data from every single Major League Baseball game played during the 2016 season. It includes categories such as home team, away team, venue, attendance, and even weather.
For this project, I will be exploring the question:
How does weather affect team performance?
Team Records – 2016
| Team | W | L | G | Win % |
|---|---|---|---|---|
| Arizona Diamondbacks | 69 | 93 | 162 | 0.425926 |
| Atlanta Braves | 68 | 93 | 161 | 0.422360 |
| Baltimore Orioles | 89 | 74 | 163 | 0.546012 |
| Boston Red Sox | 93 | 72 | 165 | 0.563636 |
| Chicago Cubs | 114 | 64 | 178 | 0.640449 |
| Chicago White Sox | 78 | 84 | 162 | 0.481481 |
| Cincinnati Reds | 68 | 94 | 162 | 0.419753 |
| Cleveland Indians | 104 | 72 | 176 | 0.590909 |
| Colorado Rockies | 75 | 87 | 162 | 0.462963 |
| Detroit Tigers | 86 | 75 | 161 | 0.534161 |
| Houston Astros | 84 | 78 | 162 | 0.518519 |
| Kansas City Royals | 81 | 81 | 162 | 0.500000 |
| Los Angeles Angels of Anaheim | 74 | 88 | 162 | 0.456790 |
| Los Angeles Dodgers | 96 | 77 | 173 | 0.554913 |
| Miami Marlins | 79 | 82 | 161 | 0.490683 |
| Milwaukee Brewers | 73 | 89 | 162 | 0.450617 |
| Minnesota Twins | 59 | 103 | 162 | 0.364198 |
| New York Mets | 87 | 76 | 163 | 0.533742 |
| New York Yankees | 84 | 78 | 162 | 0.518519 |
| Oakland Athletics | 69 | 93 | 162 | 0.425926 |
| Philadelphia Phillies | 71 | 91 | 162 | 0.438272 |
| Pittsburgh Pirates | 78 | 83 | 161 | 0.484472 |
| San Diego Padres | 68 | 94 | 162 | 0.419753 |
| San Francisco Giants | 89 | 78 | 167 | 0.532934 |
| Seattle Mariners | 86 | 76 | 162 | 0.530864 |
| St. Louis Cardinals | 86 | 76 | 162 | 0.530864 |
| Tampa Bay Rays | 68 | 94 | 162 | 0.419753 |
| Texas Rangers | 95 | 70 | 165 | 0.575758 |
| Toronto Blue Jays | 94 | 77 | 171 | 0.549708 |
| Washington Nationals | 97 | 70 | 167 | 0.580838 |
This table shows each team with their respective amount of wins and losses. It seems a bit weird that most teams have 162 games, yet some teams have more, like the Chicago Cubs with 178. This is because the Cubs played in the playoffs while other teams didn’t quite make it so far. Since playoff games were still games in 2016, I decided to keep them in the dataset.
I also added win percentage, which is the great equalizer between teams that played only 162 times and teams that played much more. This will help out a lot more later when it comes to comparing different teams and different weather.
I haven’t touched on the weather yet, but being able to create a table like this is essential to the analysis, as one will be created for each weather type.
This dataset has columns for a few different aspects to weather, but I’m only going to choose one. Instead of choosing sky conditions or wind speed I will choose temperature. This is mainly because for sky conditions there isn’t enough data for rainy games, and a lot of games are listed as unknown.
For temperature, I am going to split the data up into four categories, mostly based off what I feel is a fair description of weather. (Baseball is played April through October, so while 60 isn’t really cold, it’s colder in comparison to summer)
Cold : 60 and below
Pleasant : 61-72 degrees
Warm : 73-81 degrees
Hot : 82 and above
While these ranges aren’t really the nicest looking, they provide a slightly more even spread.
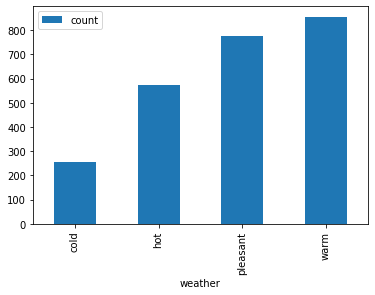
This cell here shows the game distribution for each of the four weather types. As you can see they aren’t the most even, but the sample size should be large enough to pull meaningful data for each.
Wins By Weather
Cold
| Team | W | L | G | Win % |
|---|---|---|---|---|
| Arizona Diamondbacks | 1 | 1 | 2 | 0.500 |
| Atlanta Braves | 6 | 7 | 13 | 0.462 |
| Baltimore Orioles | 16 | 8 | 24 | 0.667 |
| Boston Red Sox | 16 | 13 | 29 | 0.552 |
| Chicago Cubs | 20 | 11 | 31 | 0.645 |
| Chicago White Sox | 9 | 9 | 18 | 0.500 |
| Cincinnati Reds | 9 | 12 | 21 | 0.429 |
| Cleveland Indians | 19 | 17 | 36 | 0.528 |
| Colorado Rockies | 13 | 10 | 23 | 0.565 |
| Detroit Tigers | 12 | 9 | 21 | 0.571 |
| Houston Astros | 4 | 5 | 9 | 0.444 |
| Kansas City Royals | 3 | 7 | 10 | 0.300 |
| Los Angeles Angels of Anaheim | 3 | 1 | 4 | 0.750 |
| Los Angeles Dodgers | 1 | 4 | 5 | 0.200 |
| Miami Marlins | 3 | 5 | 8 | 0.375 |
| Milwaukee Brewers | 2 | 6 | 8 | 0.250 |
| Minnesota Twins | 7 | 16 | 23 | 0.304 |
| New York Mets | 10 | 14 | 24 | 0.417 |
| New York Yankees | 10 | 14 | 24 | 0.417 |
| Oakland Athletics | 8 | 8 | 16 | 0.500 |
| Philadelphia Phillies | 11 | 9 | 20 | 0.550 |
| Pittsburgh Pirates | 9 | 8 | 17 | 0.529 |
| San Diego Padres | 6 | 12 | 18 | 0.333 |
| San Francisco Giants | 24 | 16 | 40 | 0.600 |
| Seattle Mariners | 11 | 11 | 22 | 0.500 |
| St. Louis Cardinals | 5 | 5 | 10 | 0.500 |
| Tampa Bay Rays | 2 | 4 | 6 | 0.333 |
| Texas Rangers | 2 | 4 | 6 | 0.333 |
| Toronto Blue Jays | 7 | 4 | 11 | 0.636 |
| Washington Nationals | 7 | 6 | 13 | 0.538 |
Pleasant
| Team | W | L | G | Win % |
|---|---|---|---|---|
| Arizona Diamondbacks | 13 | 18 | 31 | 0.419 |
| Atlanta Braves | 8 | 21 | 29 | 0.276 |
| Baltimore Orioles | 31 | 25 | 56 | 0.554 |
| Boston Red Sox | 31 | 24 | 55 | 0.564 |
| Chicago Cubs | 31 | 19 | 50 | 0.620 |
| Chicago White Sox | 25 | 18 | 43 | 0.581 |
| Cincinnati Reds | 12 | 24 | 36 | 0.333 |
| Cleveland Indians | 25 | 16 | 41 | 0.610 |
| Colorado Rockies | 15 | 27 | 42 | 0.357 |
| Detroit Tigers | 24 | 26 | 50 | 0.480 |
| Houston Astros | 13 | 16 | 29 | 0.448 |
| Kansas City Royals | 24 | 21 | 45 | 0.533 |
| Los Angeles Angels of Anaheim | 30 | 32 | 62 | 0.484 |
| Los Angeles Dodgers | 40 | 35 | 75 | 0.533 |
| Miami Marlins | 17 | 14 | 31 | 0.548 |
| Milwaukee Brewers | 26 | 27 | 53 | 0.491 |
| Minnesota Twins | 18 | 32 | 50 | 0.360 |
| New York Mets | 24 | 12 | 36 | 0.667 |
| New York Yankees | 20 | 22 | 42 | 0.476 |
| Oakland Athletics | 38 | 55 | 93 | 0.409 |
| Philadelphia Phillies | 17 | 16 | 33 | 0.515 |
| Pittsburgh Pirates | 19 | 19 | 38 | 0.500 |
| San Diego Padres | 28 | 35 | 63 | 0.444 |
| San Francisco Giants | 38 | 33 | 71 | 0.535 |
| Seattle Mariners | 46 | 28 | 74 | 0.622 |
| St. Louis Cardinals | 24 | 18 | 42 | 0.571 |
| Tampa Bay Rays | 52 | 61 | 113 | 0.460 |
| Texas Rangers | 20 | 22 | 42 | 0.476 |
| Toronto Blue Jays | 42 | 42 | 84 | 0.500 |
| Washington Nationals | 25 | 18 | 43 | 0.581 |
Warm
| Team | W | L | G | Win % |
|---|---|---|---|---|
| Arizona Diamondbacks | 32 | 53 | 85 | 0.376 |
| Atlanta Braves | 24 | 26 | 50 | 0.480 |
| Baltimore Orioles | 22 | 23 | 45 | 0.489 |
| Boston Red Sox | 29 | 22 | 51 | 0.569 |
| Chicago Cubs | 45 | 22 | 67 | 0.672 |
| Chicago White Sox | 25 | 34 | 59 | 0.424 |
| Cincinnati Reds | 29 | 37 | 66 | 0.439 |
| Cleveland Indians | 39 | 18 | 57 | 0.684 |
| Colorado Rockies | 14 | 22 | 36 | 0.389 |
| Detroit Tigers | 30 | 25 | 55 | 0.545 |
| Houston Astros | 52 | 47 | 99 | 0.525 |
| Kansas City Royals | 32 | 29 | 61 | 0.525 |
| Los Angeles Angels of Anaheim | 22 | 37 | 59 | 0.373 |
| Los Angeles Dodgers | 36 | 22 | 58 | 0.621 |
| Miami Marlins | 46 | 51 | 97 | 0.474 |
| Milwaukee Brewers | 29 | 39 | 68 | 0.426 |
| Minnesota Twins | 25 | 41 | 66 | 0.379 |
| New York Mets | 31 | 27 | 58 | 0.534 |
| New York Yankees | 35 | 18 | 53 | 0.660 |
| Oakland Athletics | 11 | 22 | 33 | 0.333 |
| Philadelphia Phillies | 24 | 31 | 55 | 0.436 |
| Pittsburgh Pirates | 31 | 35 | 66 | 0.470 |
| San Diego Padres | 25 | 23 | 48 | 0.521 |
| San Francisco Giants | 19 | 21 | 40 | 0.475 |
| Seattle Mariners | 20 | 24 | 44 | 0.455 |
| St. Louis Cardinals | 27 | 27 | 54 | 0.500 |
| Tampa Bay Rays | 10 | 19 | 29 | 0.345 |
| Texas Rangers | 30 | 19 | 49 | 0.612 |
| Toronto Blue Jays | 29 | 19 | 48 | 0.604 |
| Washington Nationals | 33 | 23 | 56 | 0.589 |
Hot
| Team | W | L | G | Win % |
|---|---|---|---|---|
| Arizona Diamondbacks | 23 | 21 | 44 | 0.523 |
| Atlanta Braves | 30 | 39 | 69 | 0.435 |
| Baltimore Orioles | 20 | 18 | 38 | 0.526 |
| Boston Red Sox | 17 | 13 | 30 | 0.567 |
| Chicago Cubs | 18 | 12 | 30 | 0.600 |
| Chicago White Sox | 19 | 23 | 42 | 0.452 |
| Cincinnati Reds | 18 | 21 | 39 | 0.462 |
| Cleveland Indians | 21 | 21 | 42 | 0.500 |
| Colorado Rockies | 33 | 28 | 61 | 0.541 |
| Detroit Tigers | 20 | 15 | 35 | 0.571 |
| Houston Astros | 15 | 10 | 25 | 0.600 |
| Kansas City Royals | 22 | 24 | 46 | 0.478 |
| Los Angeles Angels of Anaheim | 19 | 18 | 37 | 0.514 |
| Los Angeles Dodgers | 19 | 16 | 35 | 0.543 |
| Miami Marlins | 13 | 12 | 25 | 0.520 |
| Milwaukee Brewers | 16 | 17 | 33 | 0.485 |
| Minnesota Twins | 9 | 14 | 23 | 0.391 |
| New York Mets | 22 | 23 | 45 | 0.489 |
| New York Yankees | 19 | 24 | 43 | 0.442 |
| Oakland Athletics | 12 | 8 | 20 | 0.600 |
| Philadelphia Phillies | 19 | 35 | 54 | 0.352 |
| Pittsburgh Pirates | 19 | 21 | 40 | 0.475 |
| San Diego Padres | 9 | 24 | 33 | 0.273 |
| San Francisco Giants | 8 | 8 | 16 | 0.500 |
| Seattle Mariners | 9 | 13 | 22 | 0.409 |
| St. Louis Cardinals | 30 | 26 | 56 | 0.536 |
| Tampa Bay Rays | 4 | 10 | 14 | 0.286 |
| Texas Rangers | 43 | 25 | 68 | 0.632 |
| Toronto Blue Jays | 16 | 12 | 28 | 0.571 |
| Washington Nationals | 32 | 23 | 55 | 0.582 |
Now let’s combine those tables into bar graphs that show how each team performs in different weather.
A few conclusions we can draw are:
- Atlanta Braves played much worse in pleasant weather than other conditions.
- Texas Rangers played better as the temperature got higher
- Kansas City Royals and Texas Rangers played worse in cold weather than other conditions, but not at all bad as the Los Angeles Dodgers did
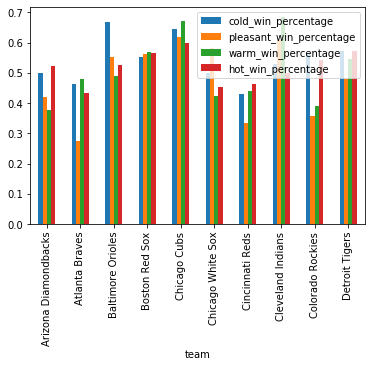
However, these graphs aren’t the very best ways of comparing from team to team. For that, I’m going to compare ratios. Now I will do bar graphs, but for how well a team performed in one certain weather compared to their overall win percentage.
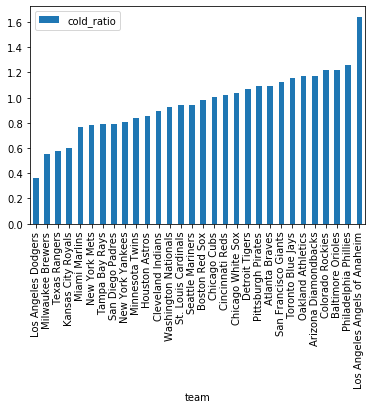
These graphs do a better job of comparing from team to team. Since I used ratios, these graphs aren’t skewed by teams having a higher or lower total winning percentage; it is all relative. Based off these graphs, we can conclude:
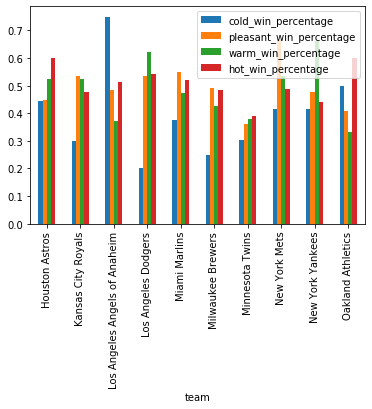
- The Los Angeles Dodgers played terribly in the cold while their LA counterpart, the Los Angeles Angels of Anaheim played amazing. These ratios might be more extreme due to too small of a sample size, as the Dodgers only played five games in the cold while the Angels only played four. The Philadelphia Phillies might be a safer bet as the best team in the cold, as they played 20 games. Sample size is only an issue for cold games, as overall there were less cold games than other weather types
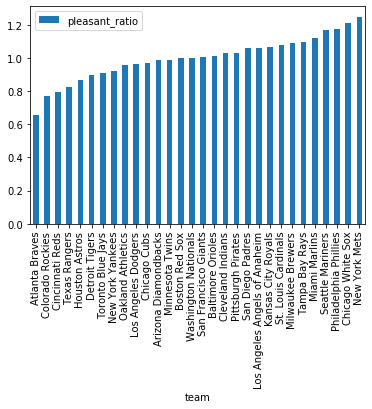
- The Atlanta Braves did not play well at all in pleasant weather, while the New York Mets and Chicago White Sox played great.
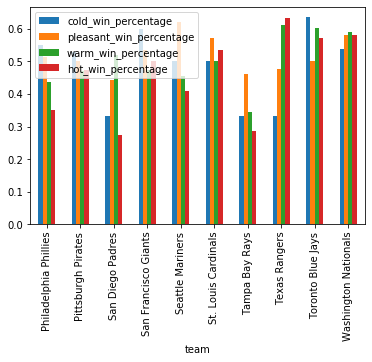
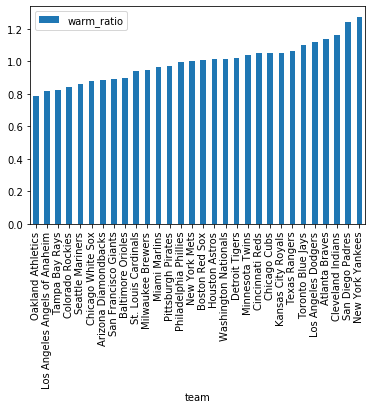
- The Oakland Athletics played the worst in warm weather, while the New York Yankees and San Diego Padres played the best.
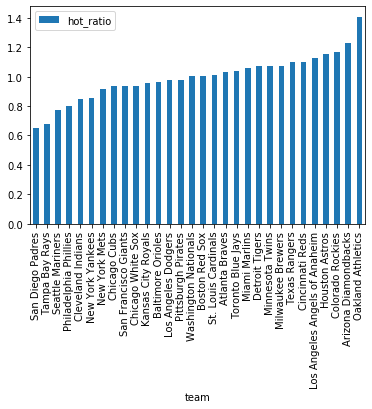
- This one is interesting. The San Diego Padres, who played the best in warm weather, played poorly in hot weather. Also playing poorly was the dome team Tampa Bay Rays, who may not have been so used to the sun. The Oakland Athletics, who didn’t play well in warm games, played the best in hot games. What a difference a few degrees could make.
We should also note that any team with a ratio greater than one played better in that weather than average, while ratios less than one played worse. From now on I’ll refer to these as “good ratios” and “bad ratios”.
For cold weather, the northeast coast teams from Philadelphia and Baltimore are towards the very top. Other teams from colder climates with good ratios are Toronto and San Francisco (San Francisco may not be generally thought of as a cold climate but they played 32 home games in cold conditions, more than any other team (second was Chicago Cubs with 21, which included many playoff games)). The worst team is the Los Angeles Dodgers, who play in warm and sunny Los Angeles. Other teams from warmer climates with bad ratios are Miami and Texas. Indoor teams with bad ratios are Tampa Bay and Milwaukee.
For pleasant weather, again, northeast coast teams New York Mets and Philadelphia are really high on the list, while teams from hot climates, Texas (Arlington) and Houston, have bad ratios. However, Miami has a hot climate and they have a good ratio.
For warm weather, warm climate teams like San Diego, Los Angeles Dodgers, and Atlanta have good ratios. However the Los Angeles Angels didn’t perform so well. The problem with warm and pleasant weather is that these conditions aren’t really extreme and during the spring and summer every city experiences many days with these conditions. Hot weather, however, isn’t quite the same way.
For hot weather, the hot climate teams like Arizona, Houston, and Texas all have good ratios. (I’ve been to a Texas Rangers game in Arlington, TX, and I can confirm it was indeed, very, very hot and sunny. I can’t say the same about the Chicago games I’ve been to.) The worst three teams are all from not-hot climates. San Diego is very far south, but it rarely gets up to temperatures that I listed as ‘hot’ (Stay classy, San Diego). Seattle is not hot, being in the rainy pacific northwest. Tampa Bay has hot weather, but their team plays in a temperature regulated dome where none of the games are listed as ‘hot’.
Overall, this was a fun little project on how different teams performed in different temperatures. A possible cause for why teams played better is based off of where they play their home games. For each condition, we notice that the best teams typically have home ballparks with a similar climate.