The Northwoods League1 is one of the nation’s premier summer collegiate baseball leagues, providing hundreds of prospects from a range of collegiate levels to showcase their skills over a 72-game summer season. I spent my summer as the Statistics & Analytics Intern for the Battle Creek Battle Jacks2, operating as the official scorekeeper for each of the team’s 36 home games.
The Northwoods League’s Scorebook software is a phenomenal tool for tracking and displaying player statistics, but it doesn’t dig much deeper than the most elementary numbers. Ultimately, this led to emphasis being placed on the wrong player evaluation metrics, with too much focus on Batting Average (AVG) and not enough on On-Base (OBP) and Slugging Percentage (SLG). Halfway through the season, upon initial creation of Wins Above Replacement (WAR), this became evident when examining the league’s elected All-Stars3. Only 25 of the 54 All-Stars (46%), were deserving of the spot based on WAR alone4. Naturally, there are other factors, but such a discrepancy makes it clear that coaches, owners, broadcasters, and staff around the league were looking in the wrong place when assessing player performance.
My favorite example of this comes from two players in the Great Lakes Division:
2B Fisher Pyatt – Battle Creek Battle Jacks via San Diego State University
.241 AVG/.418 OBP/.353 SLG, 2 HR 23 RBI, 1.1 WAR (155 PA)
3B Grant Broussard – Wisconsin Rapids Rafters via Utah Valley University
.235 AVG/.321OBP/.347SLG, 3 HR 30 RBI, 0.1 WAR (194 PA) *ALL-STAR*
Wisconsin Rapids’ Broussard was elected to the All-Star Game, while Battle Creek’s Pyatt was not. Similar across most metrics, Pyatt’s elite 20% walk-rate led to an OBP of .418, giving him an entire WAR above Broussard.
(For the full list of players and a more in-depth analysis of Pyatt vs. Broussard, click here)
Clearly, development of a WAR metric would be beneficial to the league and all of its players. The first step in developing such a metric is to create a Run Expectancy Matrix5.
Run Expectancy Matrix
The Run Expectancy Matrix is the backbone of all of sabermetrics. The matrix contains 24 cells, one for each of the unique 24 base-out states in baseball. Inside each cell is the expected runs scored after reaching this state in an inning. From this number, we can assign estimated run values to each event based on their change in run expectancy.
As I mentioned earlier, I served as the official scorekeeper for all 36 Battle Creek home games. While in this position, I logged the play-by-play of every home and away game for the team, leading to 72 full games and 6,632 total observations. From this play-by-play, I constructed the following matrix:
| Runners | 0 Outs | 1 Out | 2 Outs |
| 000 | 0.724 | 0.338 | 0.132 |
| 100 | 1.246 | 0.673 | 0.252 |
| 020 | 1.364 | 0.991 | 0.269 |
| 003 | 1.610 | 1.281 | 0.504 |
| 120 | 1.926 | 1.251 | 0.601 |
| 103 | 2.203 | 1.458 | 0.484 |
| 023 | 2.800 | 1.916 | 0.786 |
| 123 | 3.079 | 1.854 | 1.025 |
Table 1: Northwoods League Run Expectancy Matrix, 2022
Offensive WAR
Fangraphs6 uses the following formula to calculate WAR for position players:
WAR = (Batting Runs + Base Running Runs + Fielding Runs + Positional Adjustment + League Adjustment +Replacement Runs) / (Runs Per Win)
Due to lack of adequate fielding and positional data, I alter it slightly to make for an easier calculation.
WAR = (Batting Runs + Base Running Runs + League Adjustment + Replacement Runs) / (Runs Per Win)
The first component of WAR is Batting Runs, which goes by the formula:
Batting Runs = wRAA + (lgR/PA – (PF*lgR/PA))*PA + (lgR/PA – GL or GP wRC/PA))*PA
There are numerous factors in this formula, and in order to reach this step we must climb the ladder, beginning with a player’s Weighted On-Base Average, or wOBA.
wOBA is a linear combination of each batting outcome with its respective linear weight. This is where the Run Expectancy Matrix comes in. Each outcome’s linear weight is the value of its mean change in run expectancy. Since wOBA is weighted, there are two adjustments to be made after this to arrive at the final value. For simplicity and to avoid negative numbers, each linear weight is not just a change in overall run expectancy but is a change in run expectancy above an out. Finally, wOBA is put on the same scale as a more well-known statistic: OBP. In the MLB, this value is usually near .310, but in the Northwoods League it is inflated to .372.
For example, using the matrix, a double may change the base out state from runner on first with one out (1_100) to second and third with one out (1_023), for a change in run expectancy of 1.916 – 0.673 = +1.243. When compared to the average out, this play has a linear weight of 1.243 – (-0.429) = +1.672. When weighted at the wOBA scale, the final linear weight is 1.672 * 0.966 = 1.615. This is just an example for one specific plate appearance, the table below shows this process for the weight of each event.
| Event | Run Exp. | Above Out | Scaled |
| All Outs | -0.429 | 0.000 | 0.000 |
| Walk | 0.438 | 0.867 | 0.837 |
| Hit By Pitch | 0.487 | 0.916 | 0.884 |
| Single | 0.587 | 1.016 | 0.981 |
| Double | 0.944 | 1.373 | 1.326 |
| Triple | 1.261 | 1.690 | 1.632 |
| Home Run | 1.428 | 1.856 | 1.792 |
Table 2: wOBA Linear Weights
Incorporating these values into player statistics, here are the top ten players in wOBA in the 2022 season, minimum 100 plate appearances.
| # | Player | Team | wOBA |
| 1. | Ross, B | WIR | .527 |
| 2. | Sojka, A | FDL | .514 |
| 3. | Hug, C | WAU | .504 |
| 4. | Ross, S | MAN | .498 |
| 5. | Jackson, O | GB | .494 |
| 6. | Gomez, D | ROC | .486 |
| 7. | Comia, B | FDL | .485 |
| 8. | Lipsey, T | KZO | .484 |
| 9. | Mitchell, N | FDL | .483 |
| 10. | Nankil, N | WIR | .483 |
Table 3: Northwoods League wOBA Leaders (minimum 100 plate appearances, 2022)
wOBA is a rate statistic, describing how many runs a player will provide to his team per plate appearance. In order to use this in the calculation of Batting Runs, it needs to be translated into a cumulative statistic, Weighted Runs Above Average, or wRAA, as is seen in the Batting Runs formula.
wRAA is the principal component in Batting Runs, to arrive at the final number only two adjustments need to be made. The first is for a player’s home ballpark. Different home ballparks have different run environments and therefore different Park Factors7, the primary example of this is Denver’s Coors Field favoring offense due to high altitude. A similar range of environments occur in the Northwoods League, for a variety of reasons. Here are the Park Factors for each of the 21 unique ballparks, calculated on data from 2021-2022 using the method by Baseball Reference8. 100 is league average, higher numbers indicate a higher run environment. For example, a PF of 105 has 5% more runs than average.
| Great Lakes Team | Offense | Defense | Great Plains Team | Offense | Defense |
| Battle Creek BC | 92.4 | 94.4 | Bismarck BIS | 93.6 | 95.8 |
| Fond du Lac FDL | 103.4 | 102.1 | Duluth DUL | 101.1 | 102.1 |
| Green Bay GB | 104.5 | 106.6 | Eau Claire EC | 95.6 | 95.7 |
| Kenosha KEN | 107.6 | 107.2 | La Crosse LAC | 107.2 | 108.5 |
| Kokomo KMO | 95.0 | 96.4 | Mankato MAN | 92.7 | 91.3 |
| Kalamazoo KZO | 99.1 | 99.4 | Minnesota MIN | 100.0 | 100.0 |
| Lakeshore LAK | 100.3 | 100.1 | Rochester ROC | 101.4 | 102.1 |
| Madison MAD | 93.8 | 94.9 | St. Cloud STC | 102.4 | 97.7 |
| Rockford RFD | 115.1 | 115.7 | Waterloo WAT | 105.6 | 106.8 |
| Traverse City TVC | 90.3 | 87.8 | Willmar WIL | 101.1 | 98.6 |
| Wausau WAU | 102.2 | 101.9 | |||
| Wisconsin Rapids WIR | 97.0 | 94.3 |
Table 4: Northwoods League Park Factors, 2021-2022
The final adjustment is league-based. The Northwoods League is split into two conferences: Great Lakes and Great Plains. There is no interleague play, so an adjustment must be made based on a player’s league/conference. Here is the strength of each leagues run environment, in a format similar to park factors.
| Great Lakes | Great Plains |
| 97.4 | 103.4 |
Table 5: Northwoods League Division Factors, 2022
Putting it all together, here are the leaders for Batting Runs:
| # | Player | Team | Batting Runs |
| 1. | Ross, S | MAN | 34.61 |
| 2. | Ross, B | WIR | 34.44 |
| 3. | Mitchell, N | FDL | 32.72 |
| 4. | Nett, J | STC | 32.14 |
| 5. | Dykstra, R | KZO | 25.97 |
| 6. | Bobo, B | WIR | 23.82 |
| 7. | Stephan, A | KZO | 23.76 |
| 8. | Tuft, C | WIR | 22.84 |
| 9. | Campbell, K | DUL | 22.48 |
| 10. | Sojka, A | FDL | 22.37 |
Table 6: Northwoods League Batting Runs Leaders, 2022
The next component is Base Running Runs, which is found from Weighted Stolen Bases. Advancement on batted balls will be disregarded due to lack of data.
wSB = SB * runSB + CS * runCS – lgwSB * (1B + BB + HBP – IBB)
Naturally, a stolen base adds to run expectancy and a caught stealing takes runs away. wSB allows us to factor in how many runs a player subtracts from their team when they don’t attempt to steal a base at all. For example, Eau Claire Express third-baseman Sam Kuchinski9 accumulated 246 plate appearances in 53 games but did not make a single stolen base attempt. Because of this, his wSB was -0.84. Although he was never caught stealing, the missed opportunity of advancing to the next base cost his team nearly an entire run.
Here are the leaders for wSB and, subsequently, Baserunning Runs:
| # | Player | Team | Baserunning Runs |
| 1. | Guardino, R | WAT | 5.27 |
| 2. | Traficante, C | TVC | 4.52 |
| 3. | Seegers, M | LAK | 4.47 |
| 4. | Toole, M | TVC | 3.87 |
| 5. | Atkinson, A | TVC | 3.75 |
| 6. | Bateman, B | WIL | 3.75 |
| 7. | Rogers, JD | DUL | 3.75 |
| 8. | Kaiser, C | LAK | 3.29 |
| 9. | Payne, K | WIL | 2.69 |
| 10. | Donahue, J | LAC | 2.60 |
Table 7: Northwoods League Baserunning Runs Leaders, 2022
The next component is league adjustment, now factoring in baserunning runs as well. This figure was minor (< 0.1 for each league) so I will not explain any further.
The final component is replacement level. FanGraphs and Baseball Reference have agreed to the same replacement level, so I will follow it here: 1,000 total WAR in a full MLB season, with 57% attributed to position players and 43% to pitchers. The 2022 Northwoods League season comprised of only 756 games, so there will only be around 311 total WAR, ~177 for position players and ~134 for pitchers. Therefore, the following formula will output Replacement Level Runs:
Replacement Level Runs = (177.33 * (lgG/756) * (Runs Per Win/lgPA) * PA
lgG and lgPA describe the total games and plate appearances across the entire league to the current date of calculation. Runs per win (RPW) is a Pythagorean10-based statistic that determines how many extra runs a team needs to score to add an extra win. In the NWL, the value of RPW is 12.3. Ultimately, a replacement level position player is worth about 0.0349 runs per plate appearance.
After adding every component and dividing by Runs Per Win, the final calculation of Offensive WAR is complete. Here are the top ten players:
| # | Player | Team | NWL WAR | 162G WAR |
| 1. | Nett, J | STC | 3.6 | 8.7 |
| 2. | Mitchell, N | FDL | 3.6 | 8.2 |
| 3. | Ross, S | MAN | 3.6 | 8.6 |
| 4. | Ross, B | WIR | 3.5 | 7.9 |
| 5. | Dykstra, R | KZO | 2.9 | 6.4 |
| 6. | Stephan, A | KZO | 2.7 | 6.1 |
| 7. | Campbell, Kr | DUL | 2.7 | 6.4 |
| 8. | Bobo, B | WIR | 2.7 | 6.1 |
| 9. | Schwabe, C | EC | 2.5 | 6.0 |
| 10. | Tuft, C | WIR | 2.5 | 5.6 |
Table 8: Northwoods League Offensive WAR Leaders, 2022
The fifth column illustrates a player’s WAR expanded onto a full 162 game MLB season, rather than the shortened summer season. It does not decrease in perfect order since teams in the Great Lakes played more games than those in the Great Plains (72 vs. 68) due to team count.
Wins Above Replacement and other advanced stats for every Northwoods League player can be found on my public database11.
Pitcher WAR
WAR for pitchers is slightly less straightforward than it is for position players, and I use the methodology given by FanGraphs12. Here is the formula:
WAR = [[([(League “FIP” – “FIP”) / Pitcher Specific Runs Per Win] + Replacement Level) * (IP/9)] * Leverage Multiplier for Relievers] + League Correction
The main change that I make is eliminating the leverage multiplier for relievers, mostly due to a lack of adequate data.
The first step is to calculate Fielding Independent Pitching (FIP). FIP is designed as a substitute for the more common Earned Run Average (ERA), leveling out batted ball luck. FanGraphs uses FIP with infield-fly balls, but due to lack of data regular FIP will be used, with the following formula:
FIP = ((13*HR)+(3*(BB+HBP))-(2*K))/IP + constant
The constants 13, 3, -2 reflect run values and were calculated from MLB data. Out of curiosity, I fit a linear model on individual Northwoods League pitcher data (min 36 IP, 2017-2021) and received the following coefficients:
| HR | K | BB |
| 13.19 | -2.12 | 3.44 |
Table 9: FIP Model Coefficients
Close enough to validate FIP as a Northwoods League statistic. The FIP constant exists to make FIP easily comparable to ERA, giving them the same league average. Here are the ten pitchers with the best FIP, minimum 36 innings pitched.
| # | Player | Team | FIP |
| 1. | Wright, D | MAD | 2.42 |
| 2. | Lanoux, C | BC | 2.83 |
| 3. | Chalus, E | LAK | 2.84 |
| 4. | Schultz, D | MAN | 2.98 |
| 5. | Horvath, T | KMO | 3.05 |
| 6. | Clark, D | TVC | 3.26 |
| 7. | Novotny, T | WIL | 3.36 |
| 8. | Battaglia, J | STC | 3.47 |
| 9. | Candiotti, C | KEN | 3.50 |
| 10. | Seebach, K | RFD | 3.58 |
Table 10: Northwoods League FIP Leaders, 2022
Just like ERA, FIP does not describe all of the runs scored, as some are unearned. A simple adjustment turns FIP into FIP Runs Per 9 innings (FIPR9) accounting for the random, unearned runs. FIPR9 then undergoes near identical park and league adjustments as wRAA did for position players, becoming Runs Above Average Per 9 Innings (RAAP9).
The next important component is each pitcher’s Dynamic Runs Per Win (dRPW). This is similar to RPW for position players, but the difference is pitchers have more control over their run environment. If Pitcher A is a much better pitcher than Pitcher B, than Team A will need fewer runs to win than Team B does. Dividing the two metrics (RAAP9/dRPW) will output a player’s Wins Per Game Above Average (WPGAA).
However, WAR is above replacement, not average, meaning the next step is to add in replacement level. Unlike position players, this is not the same for everyone, depending on whether a pitcher is a starter or reliever, following this formula:
Replacement Level = 0.03*(1 – GS/G) + 0.12*(GS/G)
This method clearly favoritism to starting pitchers, giving them a much higher replacement leavel. This is usually accounted for by a reliever’s leverage index, which I am leaving out of the calculation. To make up for this, I move each constant halfway to the mean replacement level of 0.75, giving the following formula:
Replacement Level = 0.0525*(1 – GS/G) + 0.0975*(GS/G)
Once the replacement level is found, WPGAA becomes WPGAR. This value is multiplied by total “games” (IP/9) pitched and given a minuscule adjustment to finally become WAR. Here are the top ten pitchers in WAR:
| # | Player | Team | NWL WAR | 162G WAR |
| 1. | Thompson, R | RFD | 1.7 | 3.9 |
| 2. | Schultz, D | MAN | 1.7 | 4.1 |
| 3. | Harrison, C | LAC | 1.5 | 3.6 |
| 4. | Buhr, D | MAN | 1.5 | 3.5 |
| 5. | Wright, D | MAD | 1.4 | 3.2 |
| 6. | Lanoux, C | BC | 1.4 | 3.2 |
| 7. | Habeck, J | WIL | 1.4 | 3.3 |
| 8. | Gustafson, Ar | TVC | 1.4 | 3.1 |
| 9. | Candiotti, C | KEN | 1.4 | 3.0 |
| 10. | Chalus, E | LAK | 1.3 | 2.9 |
Table 11: Northwoods League Pitching WAR Leaders
Wins Above Replacement and other advanced stats for every Northwoods League pitcher can be found on my public database11.
Analysis
How well does WAR represent real team success? When compared with three different metrics (Win Percentage, Pythagorean Win Percentage, Simple Rating System13), WAR has a correlation near 0.83-0.85 for each one, making for a strong relationship.
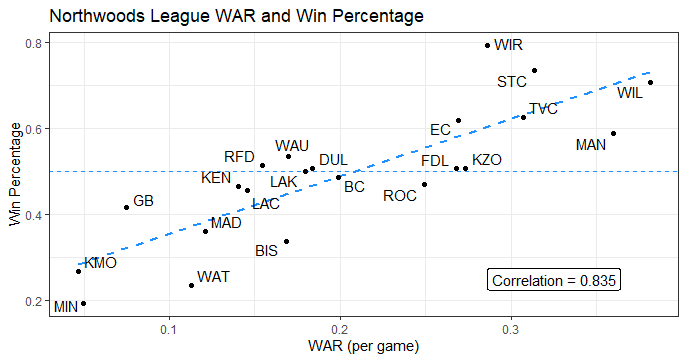
Figure 1: Northwoods League WAR Per Game and Team Win Percentages, 2022
In the Win Percentage plot, the variance remains relatively equal throughout, without any large residuals, further enhancing the relationship.
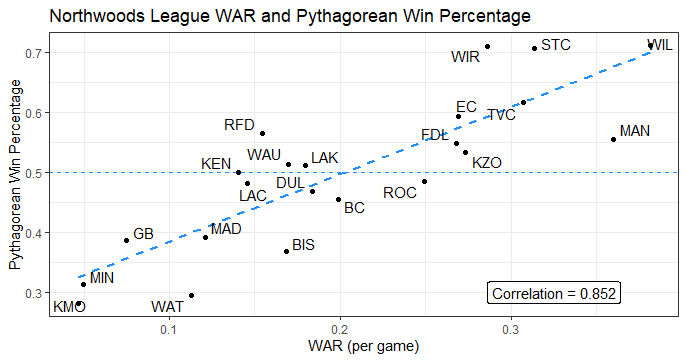
Figure 2: Northwoods League WAR Per Game and Team Pythagorean Win Percentages, 2022
The Pythagorean Win Percentage plot is similar, just on a smaller y-axis window, leading to a slightly higher correlation.
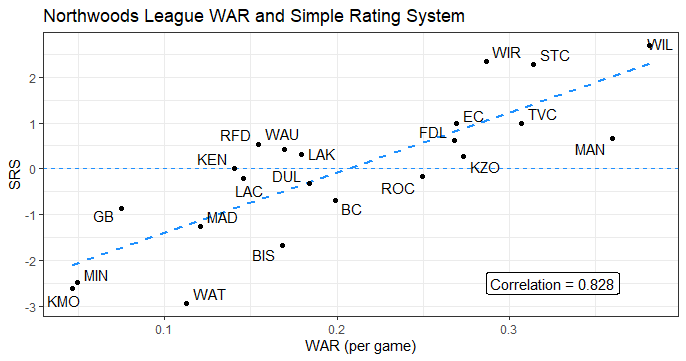
Figure 3: Northwoods League WAR Per Game and Simple Rating System, 2022
Baseball Reference’s Simple Rating System yields the lowest correlation and highest variance. This is likely due to the statistic’s importance of strength of schedule, As we know, WAR does not factor in opponent strength, causing this factor to bump certain points further from the regression line.
Conclusion
The Wins Above Replacement statistic is an accurate and effective way to analyze both individual player and team success in the Northwoods League. This metric levels the playing field for hundreds of amateur players, allowing for a more valid form of evaluation.
In the future, similar statistics can be developed for the dozens of collegiate summer baseball leagues from coast to coast. One other example was Humbert Kilanowski’s calculation of WAR for the Cape Cod League in 201914. The ultimate goal is one, all-inclusive Amateur WAR value that adjusts for not only ballparks and divisions, but for the overall talent of each summer league. Such a metric would be labor intensive and require a strong knowledge of amateur leagues, but it is one of my biggest aspirations in baseball research.
References
- Northwoods League. (n.d.). Retrieved November 9, 2022, from https://northwoodsleague.com/
- Fan’s best friend. Battle Creek Battle Jacks. (n.d.). Retrieved November 9, 2022, from https://northwoodsleague.com/battle-creek-battle-jacks/
- Admin. (2022, July 14). Northwoods League announces 2022 all-star selections. Northwoods League. Retrieved November 9, 2022, from https://northwoodsleague.com/blog/2022/07/08/northwoods-league-announces-2022-all-star-selections/
- Banks, J. (2022, July 20). Northwoods League All-War Team. Battle Creek Battle Jacks. Retrieved November 9, 2022, from https://northwoodsleague.com/battle-creek-battle-jacks/2022/07/20/northwoods-league-all-war-team/
- Tango, T. (n.d.). Run expectancy matrix, 1950-2015. Retrieved November 9, 2022, from http://www.tangotiger.net/re24.html
- Slowinski, P. (n.d.). War for position players. Sabermetrics Library. Retrieved November 9, 2022, from https://library.fangraphs.com/war/war-position-players/
- Statcast Park factors. baseballsavant.com. (n.d.). Retrieved November 9, 2022, from https://baseballsavant.mlb.com/leaderboard/statcast-park-factors/
- Park adjustments. Baseball Reference. (n.d.). Retrieved November 9, 2022, from https://www.baseball-reference.com/about/parkadjust.shtml
- Sam Kuchinski. Northwoods League. (n.d.). Retrieved November 9, 2022, from https://northwoodsleague.com/statistics/?param=%2Fstatistics%2Fplayer%2F4457%2F13%2F52
- Pythagorean theorem of baseball. Baseball Reference. (n.d.). Retrieved November 9, 2022, from https://www.baseball-reference.com/bullpen/Pythagorean_Theorem_of_Baseball
- Banks, J. (n.d.). Advanced database.xlsx. Google Sheets. Retrieved November 9, 2022, from https://docs.google.com/spreadsheets/d/1RKc4uYdQNFrKGZDfba0nH9CWbJhtNwvb/edit#gid=1149427237
- Slowinski, P. (n.d.). War for pitchers. Sabermetrics Library. Retrieved November 9, 2022, from https://library.fangraphs.com/war/calculating-war-pitchers/
- SRS calculation details. Sports Reference. (n.d.). Retrieved November 9, 2022, from https://www.sports-reference.com/blog/2015/03/srs-calculation-details/
- Kilanowski, H. (2020, June 16). cWAR: Modifying Wins Above Replacement with the Cape Cod Baseball League. Society for American Baseball Research. Retrieved November 9, 2022, from https://sabr.org/journal/article/cwar-modifying-wins-above-replacement-with-the-cape-cod-baseball-league/
- Marchi, M., Albert, J., & Baumer, B. S. (2019). Analyzing baseball data with R (Second Edition). CRC Press.